Accurate Posterior Predictive Plots for Ordbetareg Models
Description
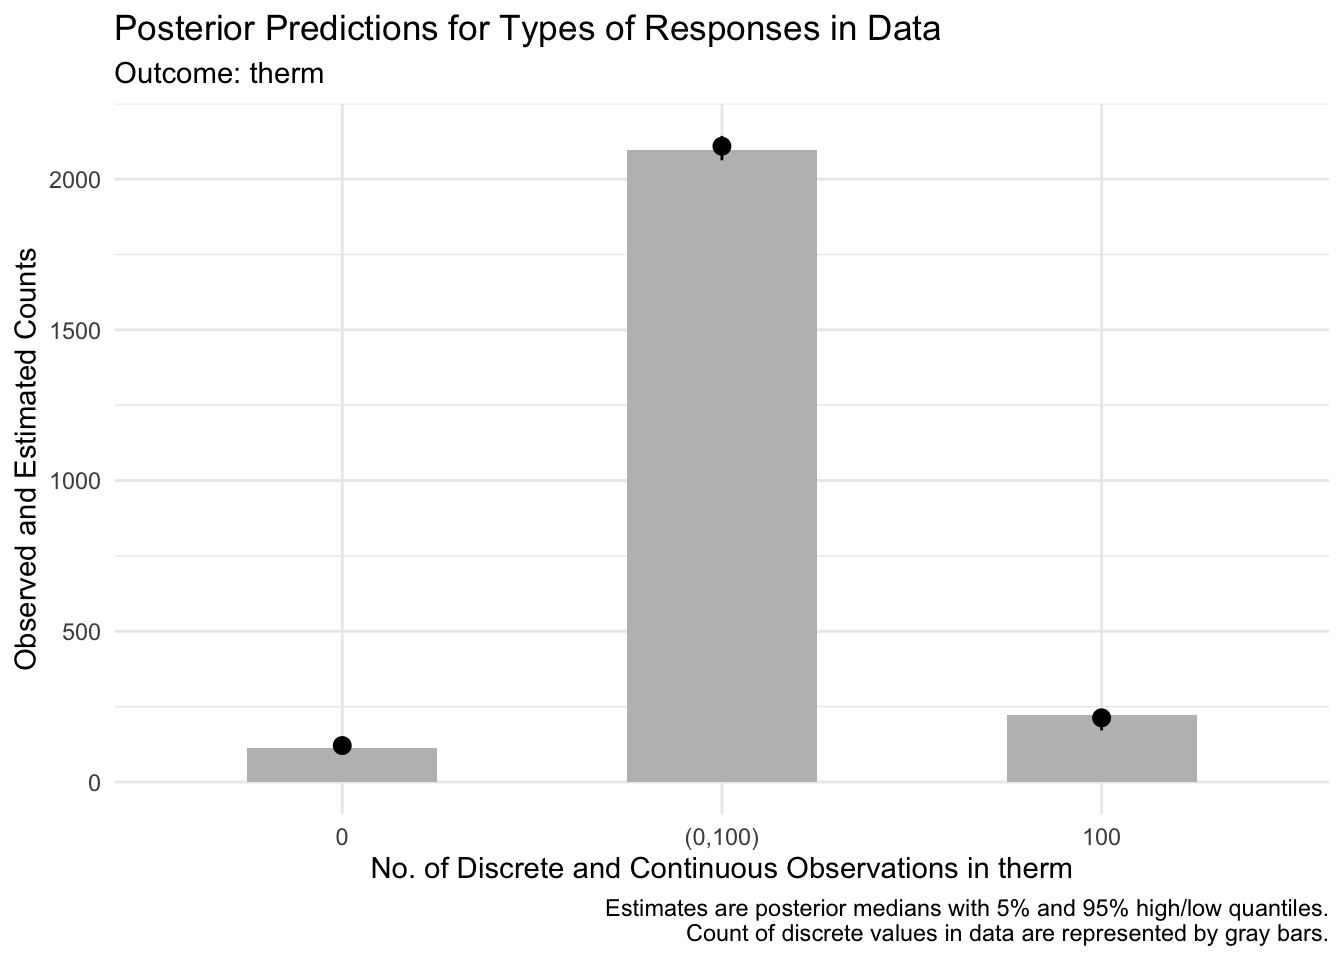
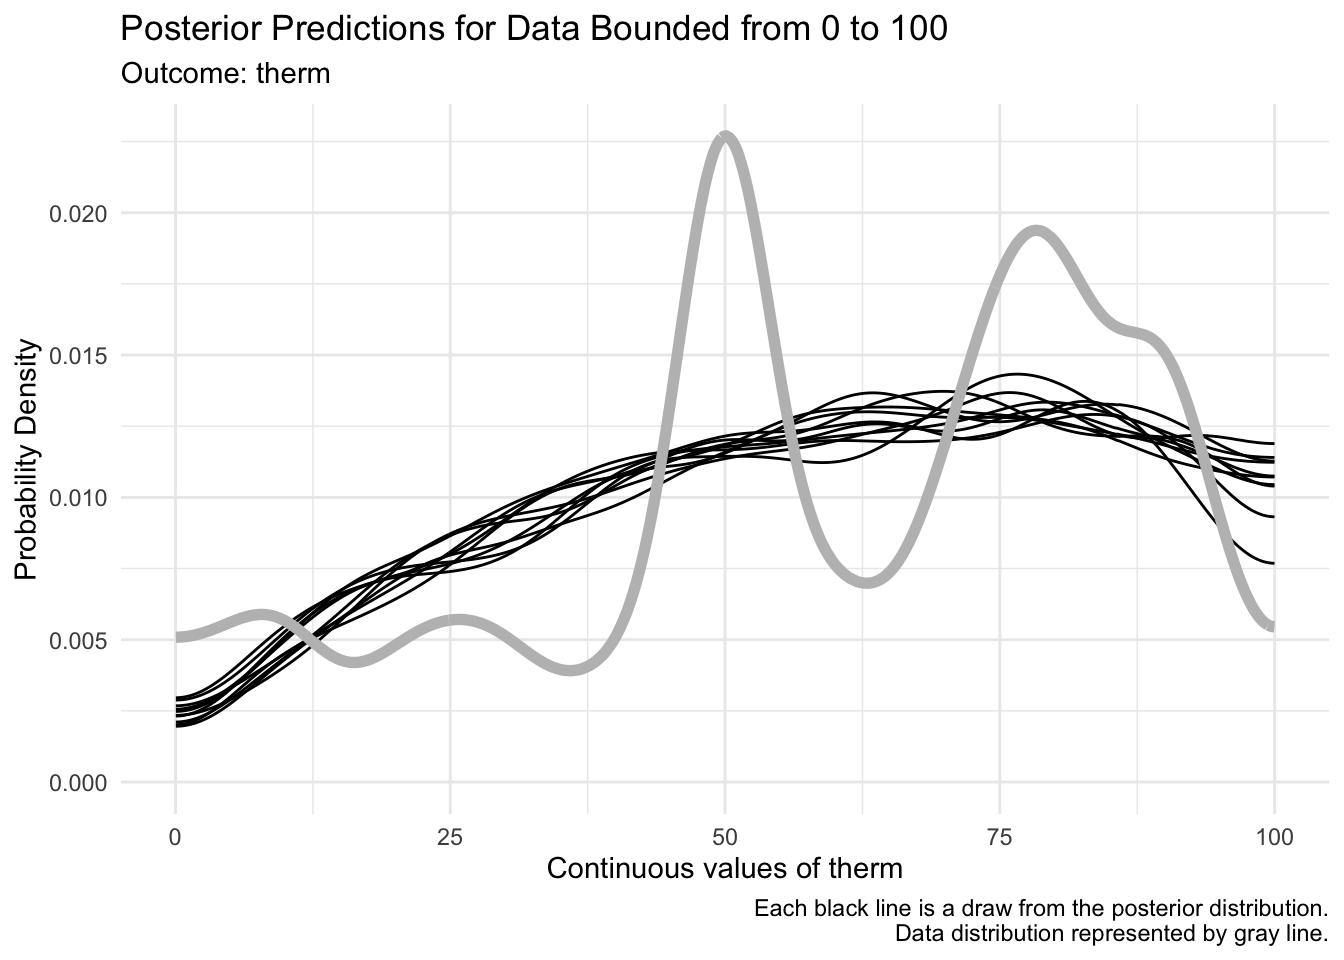
The standard brms::pp_check plot available via brms is not accurate for ordbetareg models because an ordered beta regression has both continuous and discrete components. This function implements a bar plot and a density plot for the continuous and discrete elements separately, and will return accurate posterior predictive plots relative to the data.
Usage
pp_check_ordbeta(
  model = NULL,
  dv = NULL,
  type = "both",
  ndraws = 10,
  cores = NULL,
  group = NULL,
  new_theme = NULL,
  outcome_label = NULL,
  animate = FALSE,
  reverse_bounds = TRUE,
  facet_scales = "fixed"
)
Arguments
model
A fitted ordbetareg model.
dv
If you fit a model with multiple DVs/responses, pass the name of the DV as a character value. Note: this must be the same as the name of the column in the data used to fit the model.
type
Default is "both" for creating both a discrete (bar) and continuous (density) plot. Can also be "discrete" for only the bar plot for discrete values (0/1) or "continuous" for continuous values (density plot).
ndraws
Number of posterior draws to use to calculate estimates and show in plot. Defaults to 10.
cores
Number of cores to use to produce posterior predictive distribution. Defaults to NULL or 1 core.
group
A factor variable of the same number of rows as the data that is used to broduce grouped (faceted) plots of the posterior distribution.
new_theme
Any additional themes to be added to ggplot2 (default is NULL).
outcome_label
A character value that will replace the name of the outcome in the plot (default is the name of the response variable in the data frame).
animate
Whether to animate each posterior draw for continuous distributions (defaults to FALSE). Requires installation of the gganimate and transformr R packages.
reverse_bounds
Whether to plot data using the original bounds in the data (i.e. not 0 and 1).
facet_scales
The option passed on to the facet_wrap function in ggplot2 for the type of scale for facetting if passing a variable for group. Defaults to “fixed” scales but can be set to “free_y” to allow probability density/bar count scales to vary or “free” to allow both x and y axes to vary (i.e., also outcome axis ticks).
Value
If "both", prints both plots and returns a list of both plots as ggplot2 objects. Otherwise, prints and returnst the specific plot as a ggplot2 object.
Examples
library(ordbetareg)# need a fitted ordbetareg modeldata("ord_fit_mean")out_plots <-pp_check_ordbeta(ord_fit_mean)# view discrete bar plotout_plots$discrete
# view continuous density plotout_plots$continuous
# change title using ggplot2 ggtitle functionout_plots$discrete + ggplot2::ggtitle("New title")